solo2racr
SUCK, SQUEEZE, BANG, BLOW
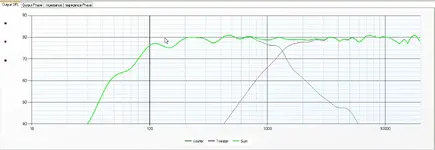
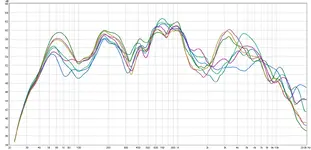
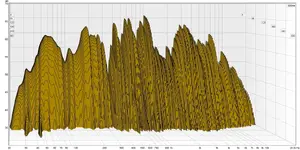
Found this Wiki page yesterday and thought it rather informative....Loudspeaker measurement - Wikipedia, the free encyclopedia. I also thought this bit from the page to be relieving....." While the very best modern speakers can produce a frequency response flat to ±1 dB from 40 Hz to 20 kHz in anechoic conditions, measurements at 2 m in a real listening room are generally considered good if they are within ±12 dB"