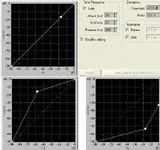
That's a "dynamics processor", typical of what comes with most editors. It's basically a multi-level compressor and expander in one.
The graph, as you see is the relationship between input volume and output volume, measured in dBFS. A perfect 45° line from lower left to upper right represents no compression or expansion; it's the function "x=y", meaning a perfect 1:1 relationship between input and output. Which is a fancy mathematical way of saying 1:1 compression, or no compression (also meaning 1:1 expansion, or no expansion.)
When you click somewhere on the line creaing a white square, or "handle", you are in effect creating a kind of threshold point. You can drag the line from that threshold point up or down, left or right. As you drag it around, it changes the slope of the line, therefore changing the input-to-output ratio and in turn the compression/expansion ratio. If you drag it so that the input value increases faster than the output value, you are increasing the compression ratio. If you change the slope so that it's the opposite ratio, you are then expanding and not compressing.
The cool thing about such processors is you can put multiple handles on the line - meaning multiple "threshold handles" - and in between those thresholds you can expand or compress just that part of the signal as you wish. The not so cool thing about them is that they are not always the best sounding dynamics processors in the world. You're not going to get a "UA sound" out of them. But for flexibility in bending and shaping the internal dynamics of a signal, they are hard to beat.
G.