Okay. I tried to run my little experiment. The process went as follows.
I used a 44.1khz Nine Inch Nails song. Not sure of the name of the song but I have the file from a past audio experiment.
To view the frequency information, I used a program called Sonic Visualizer's Spectogram. This program is free for download if you're interested in visualizing your wave forms or frequency content. Great for LOOKING at your audio ...
http://www.sonicvisualiser.org/
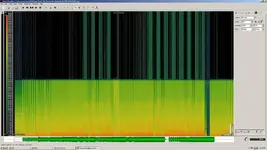
The first image I am posting represents the spectogram of the song. For those who aren't familiar with spectograms.. It is a visual representation of the frequencies that are being excited in the recording. The Y axis represents the frequency range and the X axis is time. This song is actually probably a poor choice for showing how the spectogram works. The frequency information is so dense because the mix is very very busy and extremely loud. You could usually see the dynamics and hits in the song.. this song is an exception .. but I digress.
In this image you can see that the frequency information stops at about 21 khz. This is because it is a 44.1khz cd quality song. Again, if you don't know already, the highest frequency a CD can reproduce is around 22khz. The highest this spectogram goes is 47khz. If this were recorded at 96khz with gear that functioned at those frequencies, the spectogram would have information all the way to the top of the Y axis.
When looking at this image you see that above 22khz are all void of content. This experiment is testing whether using non-linear signal processing can add higher frequency information when upsampling.
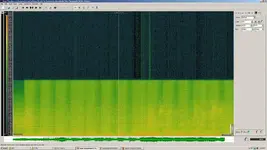
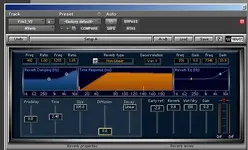
This second image is the second audio file. This file IS at 96khz. I imported the CD quality file into Pro Tools and added non-linear Waves Rverb, a reverb plug in capable of non-linear processing and 96khz sample rate (image of plug in below spectogram). With Rverb, I boosted all treble content as much as I could to see if, when upsampling, the content would affect any higher frequencies above the 22khz mark. (I also only used about 30 seconds of the song just for the experiment, so the clip isn't identical on the x axis but we are concerned with the Y axis in this experiment. )
The result was nil. There was still a brick wall (at 21khz) of high frequency content. This leads me to believe that upsampling does not affect higher frequences even when non-linear processing is applied.
") .
.