CoolCat
Well-known member
Having some trouble doing a RTA with this "audio dock"....tried like 3 different softwares and wound up only getting this strange 3-d graph?
here's the scoop........
1) I played a Pink Noise file, thru the Monitors.
SSSSHSHSHSHSHSHSHSHHSHSHSHSHSHSHHS
SSSSHSSSSSSSSSSSSSSSSSSSSSSSSSSHHHH
SSSSSSSSSSSHHHHHHHHHHSSSSSSSSSSHSHHS
2) I had the Measurement Mic plugged into the audio interface, set volume to below clipping levels. Set record levels in software below clipping, and then hit RECORD on the Software-Studio Recorder which then created a WAVE file. (approx 5 seconds)
So at this point I could playback this short recorded WAVE file...of...
SSSHSHSHSHSHSHHHHHHHHHSHSHSHSHSHSHSS
SSSSSSSSSSSSHHHHHHHHSSSSSSSSSSSSSSSHH
SSSSSSSSSSSSHHHHHHHHHHHHHHHHHHSSSSSSSS
3) I then loaded this wave sample into WAVE Lite software. At 24/48K
Again I could playback the SSSSSSHHHHHH sample.
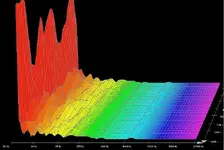
By highlighting the waveform and selecting "3-D Spectrum Analysis"
the picture/graph below was obtained.
?????????????????????
but there's no DB reading? it has the Frequency range and the right side of the picture is TIME (millseconds)...which has me confused. Is there other software that can give me a normal Freq vs. Db graph from a Wave file?
I'm about ready to go back to using a hand held Radio Shack meter and a pencil and pad and plotting perfectly, precision points pertaining possibly to playback programs professionally perceived as pliable plots. pissed.
here's the scoop........
1) I played a Pink Noise file, thru the Monitors.
SSSSHSHSHSHSHSHSHSHHSHSHSHSHSHSHHS
SSSSHSSSSSSSSSSSSSSSSSSSSSSSSSSHHHH
SSSSSSSSSSSHHHHHHHHHHSSSSSSSSSSHSHHS
2) I had the Measurement Mic plugged into the audio interface, set volume to below clipping levels. Set record levels in software below clipping, and then hit RECORD on the Software-Studio Recorder which then created a WAVE file. (approx 5 seconds)
So at this point I could playback this short recorded WAVE file...of...
SSSHSHSHSHSHSHHHHHHHHHSHSHSHSHSHSHSS
SSSSSSSSSSSSHHHHHHHHSSSSSSSSSSSSSSSHH
SSSSSSSSSSSSHHHHHHHHHHHHHHHHHHSSSSSSSS
3) I then loaded this wave sample into WAVE Lite software. At 24/48K
Again I could playback the SSSSSSHHHHHH sample.
By highlighting the waveform and selecting "3-D Spectrum Analysis"
the picture/graph below was obtained.
?????????????????????
but there's no DB reading? it has the Frequency range and the right side of the picture is TIME (millseconds)...which has me confused. Is there other software that can give me a normal Freq vs. Db graph from a Wave file?
I'm about ready to go back to using a hand held Radio Shack meter and a pencil and pad and plotting perfectly, precision points pertaining possibly to playback programs professionally perceived as pliable plots. pissed.