Graph(s) needed

  • Thread starter Thread starter SouthSIDE Glen
  • Start date Start date
SouthSIDE Glen

SouthSIDE Glen

independentrecording.net
Hey guys, I've searched all over the net and come up suprisingly empty on something I need, and I was hoping maybe one of you had something tucked away...

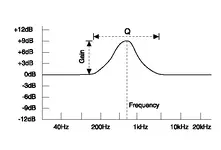
I'm in need of one of those charts/graphs that show the overlapping boost/cut curves of a graphic EQ. Which make/model it comes from is unimportant (though the more bands the better), I just need a template that I can use for cretaing a custom illustration.

Time was whn I couldn't go a day without tripping over one of those kinds of graphs in a manual or magazine, now I can't find one to save a life :cool: .

If anybody has such a graph from an EQ manual or something that they wouldn't mind passing along, I'd be much obliged :).

G.
 
Like this?
 

Attachments

  • Chart.webp
    Chart.webp
    12 KB · Views: 108
Thanks ez. Nice to finally get a reply to one of the few questions that I have posed as a thread. I appreciate it :).

Unfortunately, that's not quite what I am looking for, but close. I'm really amazed that thise graphs are so hard to find these days, they used to be so common. It's a response chart for a multiband graphic EQ that simultaneously overlays both boost and cut curves for all EQ bands on a single graph. If I could find one or a 1/3rd octave EQ I'd be extremely happy, but at this point I'll take as many bands as I can get.

Oh, and BTW, there is a pretty important error in that graphic you have. The Q width is defined as being just the central width of the curve where the value is greater than 3dB down from the peak. It is not the entire width of the curve.

G.
 
SouthSIDE Glen said:
Nice to finally get a reply to one of the few questions that I have posed as a thread.

Hey Glen, the lack of response has nothing to do with people not wanting to help you. I'm pretty sure I know what you're looking for. But, if you can't find it, chances are, we can't either. I tried to no avail. Sorry.


(I think what Carter put up is close to what you want. But I think you want something that looks like a graphic EQ with overlapping lines for the bell of each frequency's cut and boost along with the width of the sweep, if I'm not mistaken)
 
RAMI said:
Hey Glen, the lack of response has nothing to do with people not wanting to help you. I'm pretty sure I know what you're looking for. But, if you can't find it, chances are, we can't either. I tried to no avail. Sorry.
Yeah, I know that. Just trying to inject a little "guilt-bump" into the thread ;) :p


RAMI said:
(I think what Carter put up is close to what you want. But I think you want something that looks like a graphic EQ with overlapping lines for the bell of each frequency's cut and boost along with the width of the sweep, if I'm not mistaken)
Exactly. I have a generic single-band example boost/cut bell curve that I did manage to just scrape up (see attached). I can build what I need out of that, but I was hoping to find a standard ISO multi-band graph not only to save on work (I can sometimes be just as lazy as the next guy :D), but mostly to get an idea of a realistic amount of overlap between bands (or put another way, typical Q slope for each band.)
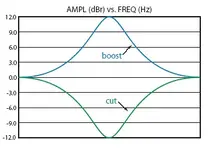
Carter, thanks for the lead. Close; the logarithmic scale and purpose are exactly what I was looking for, and the one showing the midrange characteristics is almost there, but those graphs are actually for parametric responses and situations and aren't quite what I need. Rami's explanation is a good one.

G.
 

Attachments

  • boostcut.webp
    boostcut.webp
    11.8 KB · Views: 101
Glen-

I'm fairly sure the look of the graph would depend on whether the eq was constant-Q, proportional-Q, and the amount of cut or boost applied, so the make and model may actually be important. :)
 
boingoman said:
Glen-

I'm fairly sure the look of the graph would depend on whether the eq was constant-Q, proportional-Q, and the amount of cut or boost applied, so the make and model may actually be important. :)
The kind of chart I'm thinking of shows the curves at maximum rated boost/cut (maximum overlap.)

Absolutely true on the constant/proportional Q aspect of it, that would change the nature of the individual curves. I'm not sure if there is a difference at the extremes or not, though. I'll take either one of them (both would be peachy, but beggars can't be choosers* :) )

I'd just like a rough idea of the kind of overlap there actually is. It's not really super important for my purposes, I can design the graphic a different way; I just thought that maybe one of you guys had a manual laying around that may have contained such a chart.

G.

* Diane Keaton: "Would you prefer to have sex with two women at a time?"
Woody Allen: "I'd prefer three, but I have a hard enough time getting one."
 
Carter said:

Yeah, so there is a constant-Q equalizer, all bands at +12db. It would look different at +6 db, and +3db. A proportional-Q eq would look different than a constant-Q, except at full boost or cut.

Glen- if your purpose is just to show that graphic eq filters overlap, then any graph will do. If you want to show exactly how they overlap, it isn't that simple. The topology and amount of boost or cut applied has to be taken into account.

edit- I just read your post, yeah, a proportional-Q eq at full boost/cut looks the same as a constant-Q. That is the only time proportional-Q eqs are truly 1/3 octave.
 
Ok, I just checked Carter's second page 15 :). That gives me the info I was looking for. Thanks, Carter! I owe you one. Y'all can call off the dogs now :).

There is far more overlap than I had anticipated on 1/3rd octaves. I did find one other graph from the site for pcRTA that was identical in style to the one Carter linked, and it had very similar characteristics. I didn't think the slopes would be quite so gentle.

Boingo, What I'm doing is creating a custom frequency spectrum chart for my next text that contains the usul suspects like instruemnts ranges and such, but also will have both a bit more and a bit more detailed info on it. Part of the "more info" part are going to be a couple of rows that show the placemet of the controls for a 1/3rd and a 2/3rd octave EQ in the same perspective as the rest of the stuff. Just how the overlap worked on such higher res GEQs dictates to me just how I wanted to graphically represent it. The overlap will probably not be shown in any detail, it'll be more of a general range sort of thing, but I was looking for detail of scale to help decide the best way to do it without being grossly oversimplified or inaccurate.

Thanks everybody for the help in tracking this info down. :)

G.
 
have you tried to just open up a program with preset graphical images and taking the screen shots of them? dunno if thats really what ya klooking for but it might help
 
ikon said:
have you tried to just open up a program with preset graphical images and taking the screen shots of them? dunno if thats really what ya klooking for but it might help
Not a bad idea actually, Ikon. Where were you a few days ago? (I know, I know, my fault for starting a thread just before the weekend. :rolleyes: ) :D

Fortunately at this time I have moved beyond this issue in that I already pretty much have the new waveform graphc done; just a few airbrushes here or there to touch it up is all that's left.

G.
 
SouthSIDE Glen said:
Ok, I just checked Carter's second page 15 :). That gives me the info I was looking for. Thanks, Carter! I owe you one. Y'all can call off the dogs now :).

Hey Glen. I know you got what you want, but already went through all my books and took some digital pictures of stuff regarding eq and frequency. So I just going to post the links up anyways and case someone else wants to look at them.

PLus I are already uploaded them to my site before I read this post. LOL

Warning!!

All the picture I took were in high resolution mode and are approximately .7 megabytes each and are hugh on screen!!

http://www.unparallel.net/EQ Graphs/P1151303.JPG
http://www.unparallel.net/EQ Graphs/P1151307.JPG
http://www.unparallel.net/EQ Graphs/P1151308.JPG
http://www.unparallel.net/EQ Graphs/P1151309.JPG
http://www.unparallel.net/EQ Graphs/P1151310.JPG
http://www.unparallel.net/EQ Graphs/P1151311.JPG
http://www.unparallel.net/EQ Graphs/P1151312.JPG
http://www.unparallel.net/EQ Graphs/P1151313.JPG
http://www.unparallel.net/EQ Graphs/P1151314.JPG
http://www.unparallel.net/EQ Graphs/P1151315.JPG
http://www.unparallel.net/EQ Graphs/P1151316.JPG
http://www.unparallel.net/EQ Graphs/P1151317.JPG
http://www.unparallel.net/EQ Graphs/P1151318.JPG
http://www.unparallel.net/EQ Graphs/P1151319.JPG
http://www.unparallel.net/EQ Graphs/P1151320.JPG
http://www.unparallel.net/EQ Graphs/P1151321.JPG
http://www.unparallel.net/EQ Graphs/P1151322.JPG
http://www.unparallel.net/EQ Graphs/P1151323.JPG
http://www.unparallel.net/EQ Graphs/P1151324.JPG
http://www.unparallel.net/EQ Graphs/P1151326.JPG

:p
 
Back
Top