I didn't look at the intervals, I didn't even look for a pattern.
When there's a situation where what should work doesn't (like with my noise reduction situation), when even the the most dedicated and surgical EQ plan just doesn't seem to get it - like an itch that just won't scratch, or when wider EQ scooping takes out TOO much, look for such a pattern.
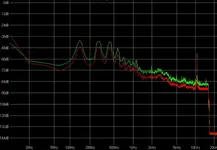
Look at your chart and think about it for a sec; unless you know the pattern is there and exactly where it is, attacking the problem with parametric EQ alone will be incomplete. Even if you managed to find the 500 and 1k bumps with a parametric sweep, the total energy distributed in all the remaining peaks exceeds what you've taken out with those two, meaning that you're still going to have an audible problem. And if you keep sweeping very carefully, the number of peaks you find will be daunting; you'll surely give up before you're done (unless you just happen to notice during the process that the bumps are evenly spaced and begin to notice the pattern that way.)
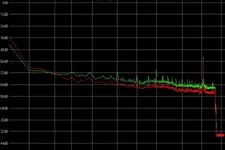
And if you try to remove that stuff with a graphic or a wide Q scoop, 90% of what you remove will be the good stuff you want to keep. So that doesn't work either.
That's when I turn to the FFT graph (and anyone who's been around here for a while knows that's not something I do very lightly) to see what's going on, and the easiest way to find the culprit is often to look for a non-random pattern in the graph. You gotta make sure it's a real pattern mathematically, but if it's there, it should pretty much jump out at you.
Now, there's no guarantee that this will completely solve your problem Ray (I still haven't had a chance to check out your file yet, I'll get to that later, hopefully), but I'll bet it'll help, at least.
G.