harmonics are multiples of the frequencies, right? So, if you hit that low C at 60Hz; you get harmonics at 120Hz;180Hz;240Hz;300Hz;360 and so on, all the way up?
Yeah, that's basically correct. It's not always a neat progression, sometimes one might find only the even multiple harmonics (e.g. x2, x4, etc.), other times the odd ones will be dominant, or a mix of them both. Theoretically they'll go "all the way up", but often the amount of energy (volume) at the higher harmonics may drop so low as to be insignificant.
They can, in which case they'd be referred to as subharmonics or undertones. But they tend to be rarer than harmonics or overtones, and when they do occur, they rarely go below the first or second undertone to any significant degree.
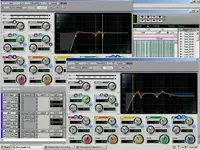
I'm not sure if the curve takes precedence or the placements of the dots/circles. I have my bass boosted 2.5db at 70Hz; but as you can see the white curve is below 2.5. do ya know which I should attend to?
The dots are how you actually set the EQ - i.e. they represent where you actually have the numbers set. But the nature of how the EQ actually works (for many reasons far too messy to get into in detail here) means that the actual EQ curve is "smoothed out" a bit, and doesn't necessarily follow exactly the sharp-edged, straight line, mountain-peak kind of profile that you'd see if you simply connected the dots. This is normal, and the smoothed-out curve of what is actually being applied is what the white line is approximating. As such, the white line is a truer representation of what is actually happening than your dots are.
All that said, I wouldn't worry too much about which one you should "attend to"; without wanting to sound like a broken record, your ears and not your eyes should be the judge here. If you have (just for example) a yellow dot set for a 3dB boost but the white curve is only showing a 2dB boost, don't worry about it, because the exact number of the actual boost is not important. What's important is
whether it sounds better or worse if you have the dot set to 3dB and the line is at 2dB or whether you boost your dot to 4dB in order pull the line up to 3dB. The dots and lines are just a reference to let you know what's happening, not a guide telling you what you should actually do.
Am I on the right track? I've been told that I'm creating a black hole in the center with my vox,bass,kick and snare b/c I turn them all up loud b/c those are the most important parts of the song.
You're doing a good job of paying attention to/worrying about details, but it's impossible for anyone to say just based upon pictures and numbers a to whether you're actually on the right track or not. First, only your tastes and desires can decide just what the "right track" actually is; i.e. just what sound you actually want to wind up with. One man might want more "fullness" in the vocals whereas another might want to put it more in the bass, and so forth. Second, it all depends upon the actual nature of the tracks you're working with, how they actually sound, and how well they do or do not play together.
This is the difficulty of using things like the frequency chart. Charts like that are meant (or at least should be meant) to help teach and describe general common characteristics of the various instruments and sound sources
only as a way of helping the listener train their ears for associating certain sounds *that they hear* with the numbers represented on their gear such as equalizers and frequency analyzers. But they should
not be used as a basis for recipes or canned procedures based upon the numbers to be selected before or without consideration for what one actually hears.
[EDIT]
I understand what you're saying about working better with visuals; some folks are just like that naturally. And that's OK. But the fact is that were are dealing with sound here, and that the ONLY way to know what something sounds like is by listening. pictures and numbers are just not sufficient to get the job done very well.
Think of it like this; imagine trying to create a painting or a photograph by the numbers. One can look at a brightness histogram of a photograph, and it can help somewhat in determining general exposure setting, but it will do nothing to tell you whether the picture actually looks "right" or not. One can numerically determine the balance of colors used in making a painting, but those number will tell you nothing about what the painting actually looks like.
I understand your propensity for the visual, but it's only going to get you so far in mixing audio until you understand how to relate what you hear at least as well. It may not be the way you're naturally inclined, but it is a learnable/trainable skill, and a necessary one at that.
*THATS* how tools like the frequency chart can come in handy, as a guide to help one understand what they are hearing. But it simply cannot be used as a substitute for critical listening.
G.

 .
.") . Basically you cut what sounds bad from this source or what's getting in the way of whatever sounds better from another source.
. Basically you cut what sounds bad from this source or what's getting in the way of whatever sounds better from another source.