You are using an out of date browser. It may not display this or other websites correctly.
You should upgrade or use an alternative browser.
You should upgrade or use an alternative browser.
Pink or White?
- Thread starter Queue
- Start date


SPINSTERWUN
Active member
cain't splain' it bra'.

(Yo estoy pocito baracho) (sp?)
")
spin
(Yo estoy pocito baracho) (sp?)
spin
Blue Bear Sound
New member
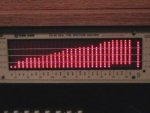
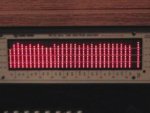
Something wrong there Queue... the pink noise clip I sent was definitely flat - I had it up on my RTA as I was burning it........
The white noise will appear shelved - it's down at the low end and ramps up to the mids (because the white noise is the same power level for all frequencies, whereas pink noise is all frequencies at the same power levels)
Those pics don't look like what I sent ya.... this would occur if you inadvertently had a filter or EQ engaged while hearing the clips.
Bruce
 :rolleyes:")
")
Queue
Active member
Bruce,
I'll play with things some more. In sound forge, when I did a frequency analysis of the file, it looked pretty darn flat. I went on an EQ hunt, thinking that there might be a filter in place somewhere, and didn't find any, but maybe the good folks at Winamp decided that a low end boost was important.
Queue
barefoot
barefootsound.com
White noise is equal amplitude across the spectrum, pink noise is equal power. An RTA which measures pink noise as flat is actually running the signal through a 6dB/octave high pass filter first.
Power is frequency dependent. High frequencies contain more power than low frequencies of the same amplitude. Our perception of loudness is more dependant on power than on amplitude. This is why pink noise sounds approximately flat.
However, our ears are not ideal power meters, hence the development of various weighting filters for noise analysis. Here's a brief explanation of this topic. http://www.lindev.com/noiswt.htm
barefoot
Blue Bear Sound
New member
BF.... I'm using a Klark-Teknik DN6000 (not a small-potatoes analyzer)... it says nothing about having a high-pass in the loop in the applications manual....
Queue, I'll post pics of the RTA reading for each so you can compare.....
Bruce
Queue, I'll post pics of the RTA reading for each so you can compare.....
Bruce
Queue
Active member
Barefoot and Bruce,
You guys are the experts here, but this is what I wanted to do:
(Highly inaccurate, but possibly helpful?)
Get the pink noise, look at the flatness (ooh aah)
Push it through my monitors, feed it into a mic at my normal listening position, and compare the curve with the original to "see" if there was any room modes happening. I'm still learning lots and lots, and thought I might be able to use a visual reference to aid my ears in identifying any problem frequencies.
(I promise to try to address any problems with room treatment, and NOT EQ.)
I'm guessing my choice of Penguin Audio Meter is not the best (for a cheezy cheapie RTA), but then again, as long as I have a reference, I can compare the mic'd curve to that, and should be able to see any huge problems?
Queue
barefoot
barefootsound.com
Bruce, I think RTA's are by definition power response meters. If it's not mentioned in the manual, then I guess they assume it goes without saying.
Actually they don't need to filter the signal. The 6dB/oct compensation can also be built into the individual meter scalings. Either way, the net result is the same.
I looked at my Sound Forge spectrum analyzer and it also works as an amplitude response meter. No power response option is given, so white noise looks flat. Not terribly convenient for mixing music, since pink noise is a more sensible reference.
barefoot
barefoot
barefootsound.com
Queue, why not just use white noise as your test signal? It's what is typically used in loudspeaker analysis (monitor frequency response graphs are amplitude, not power response). Granted, white noise is not as easy on the ears, but it will work just fine with your analyzer.
barefoot
barefoot
Blue Bear Sound
New member
BF... I'll look at the manual again - you're probably right.......
Actually I mistyped the model it's the older DN60 (the DN6000 is the latest version)....
Queue... RTA readings of the clips are below....
Bruce
Actually I mistyped the model it's the older DN60 (the DN6000 is the latest version)....
Queue... RTA readings of the clips are below....
Bruce
Blue Bear Sound
New member
Blue Bear Sound
New member
Blue Bear Sound
New member
Queue....
Since I have your attention - - what's the scoop on our little exercise? (just curious....)
Bruce
Since I have your attention - - what's the scoop on our little exercise? (just curious....)
Bruce
Blue Bear Sound
New member
Barefoot....
From the DN60 manual....
By nature of definition, randomly generated pink noise only appears to be "flat" on a spectrum analyzer when measured with a true RMS detector and averaged over a long time interval. Pink noise measured on the DN60 is very flat under these circumstances.
The detectors used in the DN60 are specially designed to perform over a wide range of averaging times, and also to register peaks. The slow response setting should be used in conjunction with the average mode for taking pink noise measurement on the DN60. If the faster time constants are used, the noise will appear unstable, particularly at low frequencies, showing the random nature of the noise source.
The averaging technique used in the DN60 is a mathematical operation performed by the microprocessor. The algorithm used results in a reading much closer to the true RMS figure than that arrived at by an "average" reading instrument employing conventional techniques.
It should be appreciated that the overall level of a "flat" pink noise signal is approximately 18db higher than the 1/3rd octave spectrum levels (since it is the summation of all these levels.) Similarly, the overall level of a passage of "peaky" music would be between 6db and 15db higher than the 1/3rd octave levels. For this reason the overall level graticule of the DN60 is offset by 10db from that of the spectrum display.
It doesn't really say much about a high-pass being in the chain... (of course, it doesn't say there isn't either!)
Bruce
Last edited:
Queue
Active member
what's the scoop on our little exercise?
I'll assume you mean the "Mastering" excersize. I've got both masters, Shailat requested a CD with the files as .wav files. I have converted the "Masters" using Exact Audio Copy, and will burn his CD this weekend. You are most likely aware of the fact that Shailat is in Israel, so you can guess where that Money Order you sent me (thanks, by the way) is going. In the meantime, I've posted over on that thread looking for suggestions as to how to let "the masses" get in on the judging.
Queue